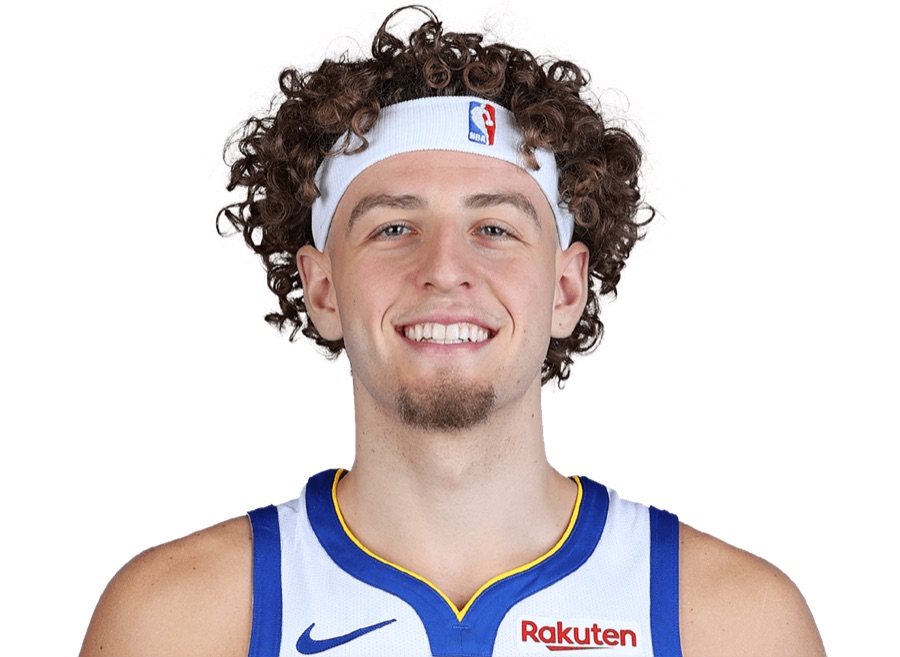
Lendeborg's minus 33 is mostly a number about Curry's minutes without him
Basketball-Reference has Golden State 33 points per 100 possessions worse with the rookie on the floor than off it. Rebuilt from ten games of play-by-play, the gap is 22, and 60 of the 63 points in the off column arrived with Stephen Curry playing and Yaxel Lendeborg sitting.
Yaxel Lendeborg's page on Basketball-Reference has two rows that should not sit next to each other. One says PER 20.2, true shooting .630, win shares per 48 minutes .149. The other says On-Off: -33.1.
That reads as a verdict: 33 points per 100 possessions worse with its Rookie of the Year candidate on the floor, on a 7-3 team he leads in minutes. Somebody is wrong, and the easy assumption is that it is the box score.
The number is real. It is also, almost entirely, a number about the other 160 minutes.
What the number is#
On-Off is a subtraction. Basketball-Reference takes Golden State's scoring margin per 100 possessions with Lendeborg on the court (-3.5, through November 7) and subtracts its margin with him off (+29.6). Both halves are team results with ten men on the floor. Neither one measures him.
The denominators are the point. Lendeborg has played 322 minutes by ESPN's box scores (Basketball-Reference rounds to 323). Golden State has played 485 in ten games, nine regulation and one overtime, so the off column holds about 162. The site's separate on-off page is thinner than that: its minutes column reads 289 on and 151 off, 440 of the 485. The 34-minute gap between its on-court figure and his minutes total matches his night against the Clippers exactly, and the page does not say why.
So I rebuilt it from ESPN's play-by-play for all ten games: seed every lineup from the starters, replay every substitution, close each game to the box score on minutes and plus-minus. Possessions are the standard estimate from attempts, offensive rebounds, turnovers and free throws. Points for and against are Golden State's and its opponents', and the last column is the margin per 100 possessions.
| Minutes | For | Against | Margin | Per 100 | |
|---|---|---|---|---|---|
| Lendeborg on the floor | 323 | 776 | 792 | -16 | -2.5 |
| Lendeborg off the floor | 162 | 410 | 347 | +63 | +19.9 |
| All ten games | 485 | 1,186 | 1,139 | +47 | +4.8 |
The on-court figure lands within a point of Basketball-Reference's. The off-court figure lands ten points short of theirs, which is what a 160-minute column does when two people count possessions differently. On the nine games their table appears to hold, the replay says -3.8 on and +19.8 off. Call the gap 22 by my count and 33 by theirs. Either way the question is who was on the floor for the 63.
Who the off minutes belong to#
The hypothesis worth testing is that Lendeborg's off minutes are Stephen Curry's on minutes. It is true. Curry sat two of the ten games, at Phoenix on October 24 and against the Clippers on November 1, so 70 of Lendeborg's minutes could not include him. Across the ten, Curry was on the floor for 36 percent of Lendeborg's minutes and 74 percent of the minutes Lendeborg sat.
| Margin, minutes | Curry on | Curry off |
|---|---|---|
| Lendeborg on | -4 in 116.5 (-1.6 per 100) | -12 in 206.8 (-2.9 per 100) |
| Lendeborg off | +60 in 120.2 (+25.8 per 100) | +3 in 41.6 (+3.5 per 100) |
Read the bottom row first. The off column is plus 63, and 60 of the 63 came with Curry on the floor. Take Curry off too and the Warriors without Lendeborg are plus 3 in 42 minutes.
Now read down the left. Curry beside Lendeborg does not fix the rookie's on-court number. The pair is minus 4 in 116 minutes; Lendeborg without Curry is minus 12 in 207. Per 100 possessions those are within about a point of each other. Whatever is happening in his minutes, it is not that he loses when Curry rests and wins when Curry plays.
Green is a different story, and so is Niang.
| Margin, minutes | Green on | Green off |
|---|---|---|
| Lendeborg on | -35 in 111.1 (-15.0 per 100) | +19 in 212.2 (+4.5 per 100) |
| Lendeborg off | +52 in 109.3 (+24.9 per 100) | +11 in 52.5 (+10.2 per 100) |
| Margin, minutes | Niang on | Niang off |
|---|---|---|
| Lendeborg on | +17 in 87.3 (+9.5 per 100) | -33 in 236.0 (-7.0 per 100) |
| Lendeborg off | +48 in 119.2 (+20.6 per 100) | +15 in 42.5 (+17.8 per 100) |
Green's presence moves Lendeborg's on-court number about 19 points per 100 the wrong way. Niang's moves it about 16 the right way. Curry's moves it about 1. Cam Ellis has the Green half of this, the pair minus 40 in 78 minutes through eight games, and the Niang half, Niang plus 69 in 206 minutes for the season. The ten-game replay agrees with both and adds the Curry cell, which is the one that explains the page.
The three tables overlap, because the off column is largely one kind of unit: Curry and Green with the reserves, usually Niang among them, while Lendeborg and Brandin Podziemski sit. It is lumpy. Its busiest five, Curry, Green, Gary Payton II, De'Anthony Melton and Niang, is minus 8 in 36.6 minutes. Thirty-seven of the column's 63 points came against the Lakers on October 30, in 23.8 minutes, a night Lendeborg was minus 20 in 24. One Friday moved the raw gap by 57 points.
When, and against whom#
Fifty-six percent of Lendeborg's minutes come in the first and third quarters. Thirty-seven percent of the off minutes do. One step past the quarter: opponents had four or five of their own starters on the floor for 50 percent of his minutes and 35 percent of the minutes he sat, an average of 3.3 opposing starters against him and 2.9 against the units that replace him.
That is a measured difference in who was across from each column. How many of the 22 points it buys, the logs cannot say.
How wide 160 minutes is#
The off column is 317 possessions by the replay's count, the on column 652. I resampled the replayed stints 10,000 times, 130 off-court and 269 on-court, and read the 90 percent range.
| Replay | 90 percent range | |
|---|---|---|
| On-court net per 100 | -2.5 | -15 to +11 |
| Off-court net per 100 | +19.9 | +2 to +38 |
| On-Off | -22.4 | -44 to 0 |
The off column's range is 36 points wide and the gap's range reaches zero. That is the sample talking, not a claim that the true gap is zero. The direction is suggested. The magnitude is not something ten games can hold still.
Why the box numbers can all be good at once#
Each figure on the other row is built from Lendeborg's own line. PER, in Basketball-Reference's glossary, sums a player's positive accomplishments, subtracts the negative ones and returns a per-minute rating, scaled so the league average is 15; he is at 20.2. True shooting percentage is points divided by twice the shooting possessions, so it credits threes and free throws; .630 on 71 of 141 from the field and 23 of 57 from three. Win shares per 48 minutes estimate wins contributed per 48, league average near .100; he is at .149. Box plus/minus is a box-score estimate of points per 100 possessions above a league-average player; 1.5 is above it. VORP is the same estimate against a replacement player set at -2.0, prorated to 82 games; 0.3 is a tenth of a season of clearing that bar.
None of them knows who else was on the floor. On-Off knows nothing else. A rookie can shoot .630 while his team scores 119 points per 100 in his minutes and 129 in the minutes he sits, and allows 121 and 110, which by the replay is what has happened. The box metrics score his shooting. On-Off charges him for both ends of a floor with nine other men on it. The hole between them is the scheme, the matchups and the other four men.
The award, as priced#
VegasInsider's table, updated November 8, lists five books. Cameron Boozer is the favorite at every book, +190 to +200. Lendeborg is +225 at Caesars, +250 at Bet365, +275 at BetMGM, +290 at FanDuel and +310 at DraftKings. Darius Acuff Jr. runs +310 to +350, AJ Dybantsa +600 to +650 and Caleb Wilson +850 to +1200. On Kalshi's market on the morning of November 9, Lendeborg last traded at 32 cents, Acuff at 28 and Boozer at 23.
Sports Illustrated's second Rookie of the Year rankings, November 7, have Lendeborg first, then Acuff, Boozer, Wilson and Dybantsa. NBC Sports Bay Area's Rookie Watch of November 4 has him first, then Boozer, Wilson, Acuff and Darryn Peterson, and notes he would be the first Warrior to win the award since Chris Webber in 1993-94. Basketball-Reference's award page agrees: no Golden State rookie has won it since.
The sportsbooks have him second, Kalshi's traders have him first, the rankings have him first, and none of them is reading On-Off.
What he is to a 7-3 team#
He leads the roster in minutes at 322 and is second in scoring at 21.2 points a game, behind Curry's 31.2 in eight, with 7.2 rebounds and 4.0 assists on .504 from the field, .404 from three and .758 from the line, all recounted from ESPN's ten box scores. He has started every game. On the night Curry and Green both sat, he scored 37 and Golden State beat the Clippers by 12. "It's remarkable the impact he's making on these games in the first couple weeks of the season," Steve Kerr said afterward, per ESPN. "It changes everything."
What he is not, on ten games of evidence, is the reason the Warriors have been outscored in his minutes. The on-court column says the team has been close to even with him playing, -2.5 per 100 by my count and -3.5 by theirs. The off column says a Curry-led second unit has spent 120 minutes beating other teams' second units by 60. Subtract one from the other and you get a true number with a wide range and no verdict in it.
The read: on December 16, Basketball-Reference's on-off page for Lendeborg shows an On-Off figure better than -15.0, covering Golden State's games through December 15. The case for it is that the off column is about 320 possessions of a bench unit on a hot month, the Lakers night is more than half of its margin, and the on-court figure it is subtracted from is already near even. The case against is that the structure does not have to regress: Kerr rests Curry and Lendeborg at different times by design, the units that replace the rookie have outscored opponents in seven of ten games by the replay, and his own first ten games are the precedent, -33.1 on the page and -22.4 by replay.
Golden State's ten regular-season games, October 21 to November 7, from ESPN's play-by-play and box scores. Lineups seeded from the starters and from the first players to act in each period, then replayed through every substitution; points from the running score; possessions by FGA - OREB + TOV + 0.44 FTA, averaged across both teams per stint. Replay minutes close to the box within a minute for every Warrior in all ten games; plus-minus closes exactly in five games and within 3 points per player in the other five, where a basket or free throw shares a clock with a substitution. The 90 percent ranges are a 10,000-draw bootstrap over stints, which treats stints as independent and understates the spread if they are not. Basketball-Reference's figures are its own, on its possession formula, and its on-off table appears to cover nine of the ten games.
Sources: Basketball-Reference's player page and 2026-27 on-off page for Yaxel Lendeborg, both stamped as updated November 9 with games through November 7, and its glossary and Rookie of the Year award page. ESPN summary feeds, box scores and play-by-play for events 401909092, 401909850, 401909860, 401909876, 401909888, 401909285, 401909905, 401909919, 401909937 and 401909942. VegasInsider's Rookie of the Year odds table, updated November 8, 2026. Kalshi's 2026-27 Rookie of the Year market, November 9, 2026. Sports Illustrated, Rookie of the Year Rankings 2.0, Blake Silverman, November 7, 2026. NBC Sports Bay Area, Rookie Watch, Dalton Johnson, November 4, 2026. ESPN, Anthony Slater, November 1, 2026, for Kerr's quote.