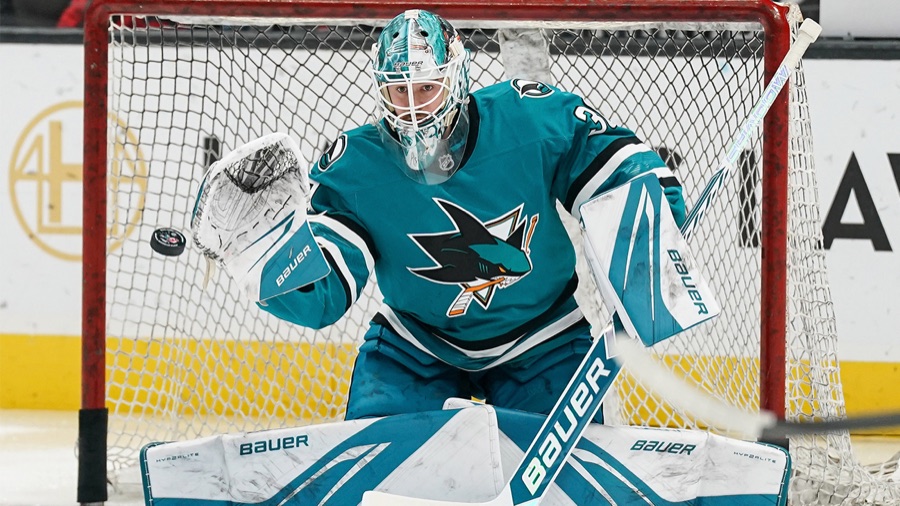
San Jose's chances came back. Its shooting is still the league's worst.
San Jose took 49.4% of five-on-five expected goals this week and lost all four games. Its five-on-five shooting, 23 goals on 374 shots, is last of 32.
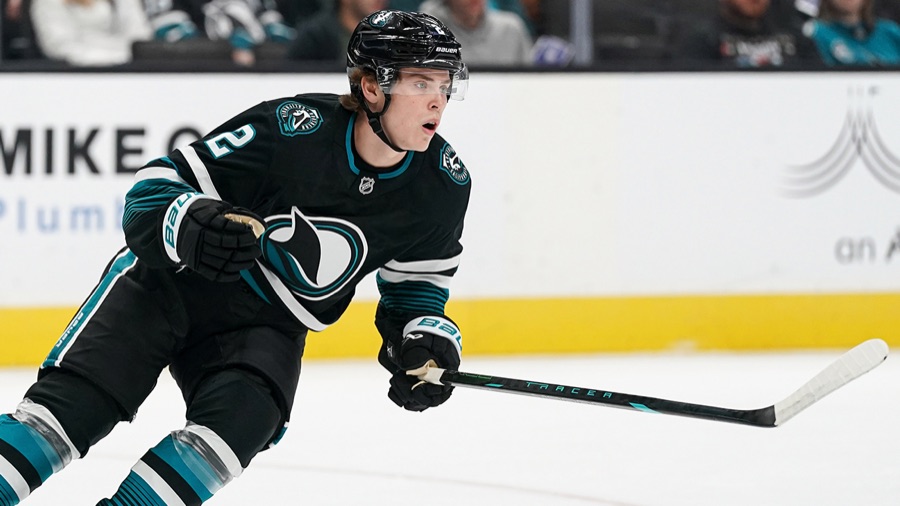
San Jose took 49.4% of the five-on-five expected goals this week and lost all four games in regulation. MoneyPuck's game-by-game table has the Sharks at 7.21 expected goals for and 7.39 against across the four games. They scored four goals on 75 five-on-five shots, a 5.3% return, and the week's finals added up to seven goals for and 17 against.
The uneven recovery#
The season's chance shares have moved around considerably. Across successive five-game spans, San Jose went from 34.2% of five-on-five expected goals to 52.8% to 37.1%, before this week's recovery. Among the four spans, this week's expected-goal share ranks second, and its 54.2% share of shot attempts ranks first.
The defensive improvement against games 11-15 is substantial. Five-on-five shots allowed fell from 34.8 per 60 minutes to 24.4, and expected goals allowed fell from 3.68 per 60 to 2.51. Across all situations, the Sharks allowed 108 shots in four games, or 27.0 a game. Their own five-on-five expected-goal production rose more modestly, from 2.17 per 60 minutes in games 11-15 to 2.45 this week, over 176.9 minutes.
The bottom of the shooting column#
The shooting column has supplied no comparable recovery. In chronological order, the five-on-five returns are:
- Games 1-5: 8.4%, seven goals on 83 shots.
- Games 6-10: 5.4%, seven goals on 129 shots.
- Games 11-15: 5.7%, five goals on 87 shots.
- Games 16-19: 5.3%, four goals on 75 shots.
MoneyPuck's team season summary puts San Jose last among 32 teams at 6.15%, with 23 goals on 374 five-on-five shots. The league-wide rate across those 32 teams is 9.76% of five-on-five shots. San Jose's 10.88-goal shortfall against expected goals is also the largest among 32 teams.
The shooters own a large share of the deficit, though not all of it. Even scoring exactly its 33.88 expected goals would leave San Jose behind the 41 five-on-five goals it allowed. Chance creation itself ranks 27th among 32 teams, at 2.25 expected goals per 60 minutes across the season.
Will Smith gives the shortfall a name without supplying a diagnosis. MoneyPuck's skater season table has him leading San Jose in individual five-on-five expected goals, with 4.17, against two actual goals on 33 shots. Collin Graf has one goal against 3.28 expected, while Michael Misa has three against 3.00. The gap is not shared equally: Macklin Celebrini has four goals against 3.78 expected across 17 games.
The kill and the standings#
The penalty kill supplied the week's sharpest deterioration. San Jose entered with 42 kills in 50 shorthanded opportunities, or 84.0%, through 15 games. This week brought 10 kills in 18 opportunities, 55.6%, and eight opposing power-play goals. The season rate is now 76.5%, 52 kills in 68 opportunities through 19 games.
The losses have extended the regulation losing streak to five games. Points percentage is the comparison because games played differ: San Jose's .395, from 15 points in 19 games, places it 14th of 16 in the West and seventh of eight in the Pacific. A week ago it stood at .500 through 15 games and 10th in the West. Utah occupies the second wild-card place at .583, with 21 points in 18 games; San Jose has two regulation wins in 19 games.
The next opponents#
Monday's home game against the Islanders offers a finishing test against a team fifth among 32 in five-on-five save rate. New York has stopped 91.38% of opposing five-on-five shots across 16 games. Wednesday brings Pittsburgh at home, with a much lower save rate, 88.09% across 17 games, ranking 30th of 32. The opening comes with offensive pressure attached: Pittsburgh generates 2.85 five-on-five expected goals per 60 minutes, sixth among 32 teams.
Saturday at Utah puts the damaged kill opposite the league's leading power play, converting 37.1% of its opportunities across 18 games. Utah also owns 57.0% of five-on-five expected goals over that span, third among 32 teams. Then San Jose travels home for Nashville on Sunday, completing the back-to-back against another strong power play. Nashville converts 29.8% of its opportunities across 17 games, fifth among 32 teams.
The arguments against me#
- The improvement remains brief. Score-and-venue adjustment lowers this week's expected-goal share to 48.5% across four games, and the earlier recovery to 52.8% lasted a five-game span before the next span fell to 37.1%.
- Finishing cannot absorb the penalty kill's responsibility. Opponents scored eight power-play goals across the week's four games.
- The season's defensive chances remain poor even after the recovery. MoneyPuck's team season summary ranks San Jose 30th among 32 teams in expected goals allowed, at 2.95 per 60 five-on-five minutes.
Sources: NHL standings, club schedule and stats API team summary and penalty-kill reports; MoneyPuck's 2026-27 team game-by-game, team season and skater season files.