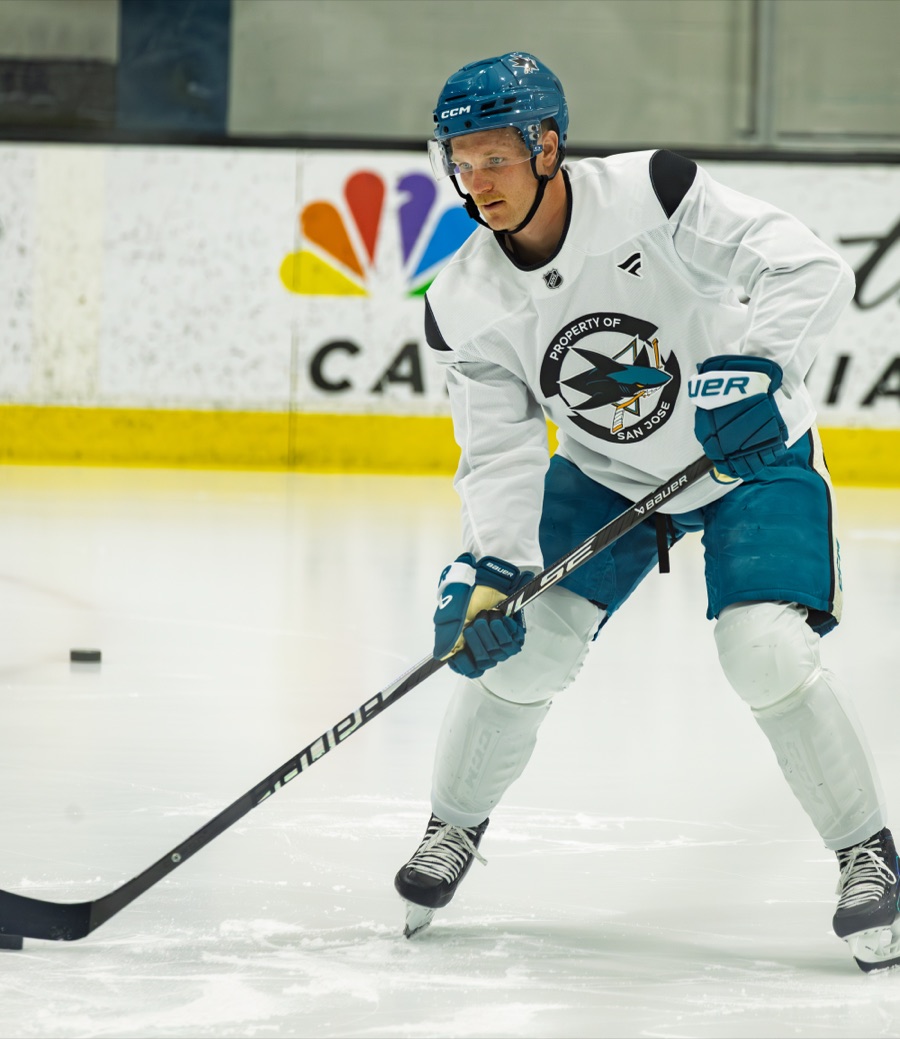
The card
All cards →
-12.5
Pine Net Rating v0.1: goals above replacement per 82 games (-7.0 over his 46). 4% among 469 forwards, 4th line.
- Position
- C
- Number
- #10
- Shoots
- R
- Age
- 26
- Size
- 6'2", 185 lb
- Ice time
- 14:11 a game
- Games
- 46
- Status
- Under contract
- Pieces here
- 28
2025-26 regular season: 46 games, 653 minutes.
2026-27: -8.1 (range -22.1 to +5.8). 2030-31: -11.1 (range -43.3 to +21.1).
- Market value
- $850K
- Cap hit
- $1.625M
- Surplus
- −$775K
- Positive value
- 42%
Market value is what the league pays a forward at his rating percentile this season, from 386 contracts; in 2026-27 dollars against a $104M ceiling. Positive value is the share of 2,000 simulated futures over his 2 remaining years in which that value meets his cap hit.
The number on each bar is his percentile among league forwards with 200 or more minutes at 5-on-5 (special teams: 30 or more minutes on the unit); each block prints the size of that group. Higher is better on every bar; chances against are inverted so 90% always reads well.
Sources: NHL.com for the roster, bio and counting line; MoneyPuck for expected goals, on-ice chances, blocks and penalties; PuckPedia and CapWages for the contract. Updated 2026-09-13. The rating, the forecast and the value line are this site's own, from public data, with the method published.
On the record
Called Shots →Ty Dellandrea's time on ice per game for San Jose in 2026-27 finishes below 13:00, down from 14:11 in 46 games in 2025-26.
Barclay Goodrow averages less than 1:55 of shorthanded ice time per game across San Jose's first 20 games of 2026-27, down from 1:55 across all 82 games in 2025-26.
San Jose scores 2.0 or fewer goals per sixty minutes at even strength with Zack Ostapchuk on the ice across the club's first 25 games of 2026-27, no better than the 1.6 he posted across 59 games in 2025-26.
Mason Marchment finishes the 2026-27 regular season with an even-strength offensive zone start share below 60 percent for San Jose.
Written about him
Zack Ostapchuk Got Some Of The Hardest Ice In San Jose And The Puck Stayed Out Of The Net
Zack Ostapchuk started 33.8 percent of his even-strength shifts in the offensive zone last season, third-lowest of the thirteen San Jose forwards who dressed 40 times, and San Jose allowed 2.7 goals per sixty with him on the ice at even strength, tied with Collin Graf for the lowest rate in that group. The same table has him at 1.6 goals for per sixty, tied third-lowest. The four-year contract signed in June is a bet that the second number moves, and both public line projections put him back with the wingers it did not move with.
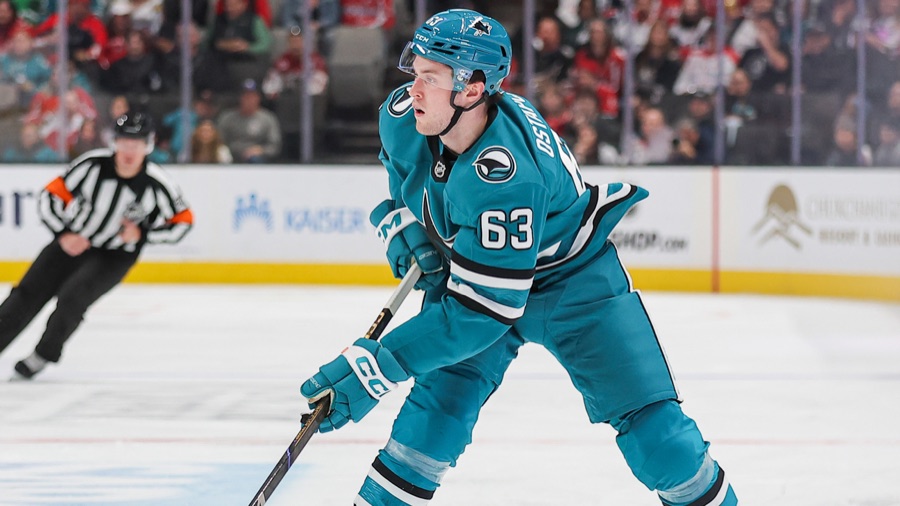
Ty Dellandrea Killed More Penalties Per Night Than Any San Jose Forward
Ty Dellandrea posted the worst even-strength expected-goals-against rate of any San Jose forward last season, 2.98 per sixty, and the most shorthanded ice time per game of any San Jose forward, 2.57, in the same 46 games. The Sharks pay him $1,625,000 for two more years with no trade protection. The season's question is not whether he can score. It is whether a club that used him 14:11 a night, tenth among the nineteen forwards it dressed, uses him that much again.