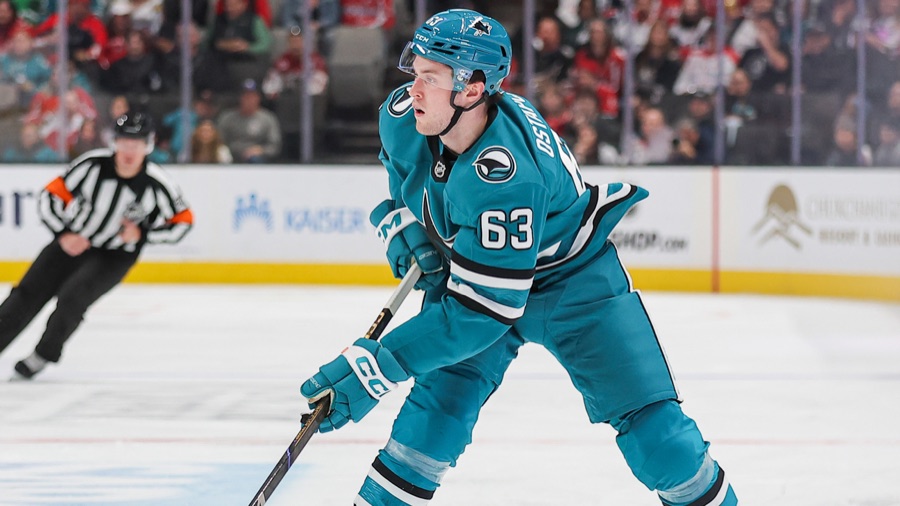
The card
All cards →
-1.4
Pine Net Rating v0.1: goals above replacement per 82 games (-1.0 over his 59). 32% among 469 forwards, 3rd line.
- Position
- C
- Number
- #63
- Shoots
- L
- Age
- 23
- Size
- 6'4", 212 lb
- Ice time
- 10:06 a game
- Games
- 59
- Status
- Re-signed June 27, 2026 (4yr)
- Pieces here
- 21
2025-26 regular season: 59 games, 596 minutes.
2026-27: +0.6 (range -12.7 to +14.0). 2030-31: +0.8 (range -29.8 to +31.4).
- Market value
- $2.45M
- Cap hit
- $2.35M
- Surplus
- +$100K
- Positive value
- 63%
Market value is what the league pays a forward at his rating percentile this season, from 386 contracts; in 2026-27 dollars against a $104M ceiling. Positive value is the share of 2,000 simulated futures over his 4 remaining years in which that value meets his cap hit.
The number on each bar is his percentile among league forwards with 200 or more minutes at 5-on-5 (special teams: 30 or more minutes on the unit); each block prints the size of that group. Higher is better on every bar; chances against are inverted so 90% always reads well.
Sources: NHL.com for the roster, bio and counting line; MoneyPuck for expected goals, on-ice chances, blocks and penalties; PuckPedia and CapWages for the contract. Updated 2026-09-13. The rating, the forecast and the value line are this site's own, from public data, with the method published.
On the record
Called Shots →Ty Dellandrea's time on ice per game for San Jose in 2026-27 finishes below 13:00, down from 14:11 in 46 games in 2025-26.
Barclay Goodrow averages less than 1:55 of shorthanded ice time per game across San Jose's first 20 games of 2026-27, down from 1:55 across all 82 games in 2025-26.
San Jose scores 2.0 or fewer goals per sixty minutes at even strength with Zack Ostapchuk on the ice across the club's first 25 games of 2026-27, no better than the 1.6 he posted across 59 games in 2025-26.
Mason Marchment finishes the 2026-27 regular season with an even-strength offensive zone start share below 60 percent for San Jose.
Ivar Stenberg appears in 11 or more of San Jose's first 13 regular-season games in 2026-27.