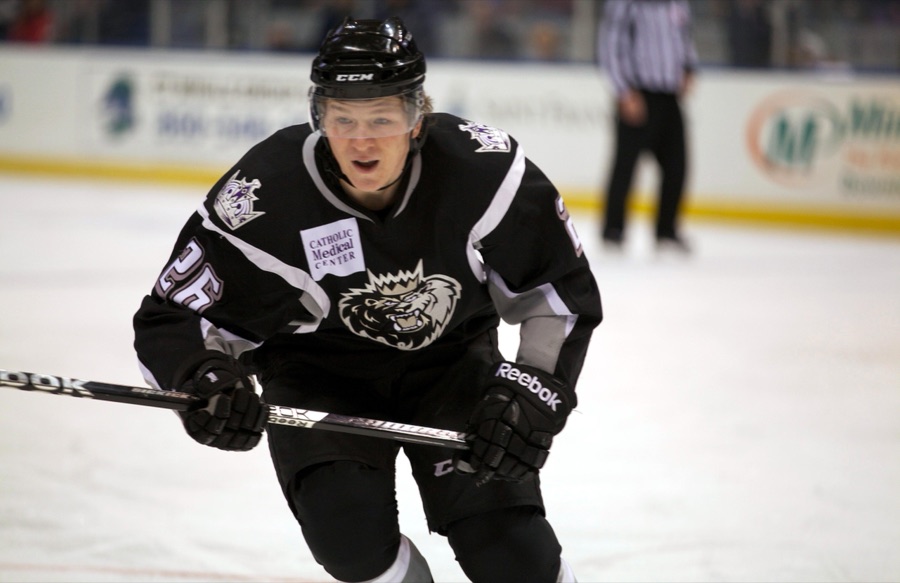
The card
All cards →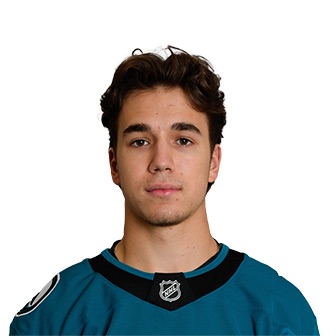
+1.8
Pine Net Rating v0.1: goals above replacement per 82 games (+1.0 over his 45). 45% among 469 forwards, 3rd line.
- Position
- C
- Number
- #77
- Shoots
- L
- Age
- 19
- Size
- 6'1", 185 lb
- Ice time
- 12:49 a game
- Games
- 45
- Status
- Under contract (ELC)
- Pieces here
- 57
2025-26 regular season: 45 games, 576 minutes.
2026-27: +4.7 (range -8.2 to +17.6). 2030-31: +8.5 (range -21.1 to +38.1).
- Market value
- $3.25M
- Cap hit
- $975K
- Surplus
- +$2.275M
- Positive value
- 92%
Market value is what the league pays a forward at his rating percentile this season, from 386 contracts; in 2026-27 dollars against a $104M ceiling. Positive value is the share of 2,000 simulated futures over his 2 remaining years in which that value meets his cap hit.
The number on each bar is his percentile among league forwards with 200 or more minutes at 5-on-5 (special teams: 30 or more minutes on the unit); each block prints the size of that group. Higher is better on every bar; chances against are inverted so 90% always reads well.
Sources: NHL.com for the roster, bio and counting line; MoneyPuck for expected goals, on-ice chances, blocks and penalties; PuckPedia and CapWages for the contract. Updated 2026-09-13. The rating, the forecast and the value line are this site's own, from public data, with the method published.
On the record
Called Shots →Michael Misa finishes the 2026-27 regular season with fewer than 60 points. Scored off his official NHL regular-season point total for the season, from any single source that carries it: 59 or fewer is a hit, 60 or more is a miss. Points for any club count, not only San Jose, so a trade does not make the row unresolvable. Misa is the single largest rate increase asked of any returning player on the board this piece examines, from 0.47 points per game as a rookie to 0.71.
Kiefer Sherwood averages under 1:45 a night on the power play across San Jose's first 20 games of 2026-27.
Alexander Wennberg finishes the 2026-27 regular season with more power-play points than Michael Misa.
Collin Graf is not among San Jose's top eight forwards in total power-play time on ice across the club's first 20 regular-season games of 2026-27.
San Jose's penalty kill finishes the 2026-27 regular season ranked higher among the 32 NHL clubs than San Jose's power play.
Ivar Stenberg appears in 11 or more of San Jose's first 13 regular-season games in 2026-27.
Michael Misa averages at least 1:00 of shorthanded ice time per game across San Jose's first 20 regular-season games of 2026-27. Scored from Hockey Reference's 2026-27 San Jose time-on-ice table, the shorthanded TOI column, restricted to the club's first 20 games; games Misa does not dress do not count toward the average, and if he dresses for fewer than 10 of the 20 the row is void. His 2025-26 figure across 45 games was 0:00.
Will Smith finishes the 2026-27 NHL regular season with an on-ice goal share at five-on-five below 52 percent for San Jose.
Written about him
The Ice Time Michael Misa Is Missing Is Mostly Not Even Strength
Alexander Wennberg averaged 20:27 a night across 80 games last season and Michael Misa averaged 12:49 across 45. Hockey Reference splits that 7:38 gap three ways: 3:19 of it is even strength, 2:11 is power play and 2:08 is the penalty kill, where Misa's column reads 0:00. Every projection on file moves Misa into Wennberg's job. Most of the ice time attached to that job is not the part a promotion delivers.
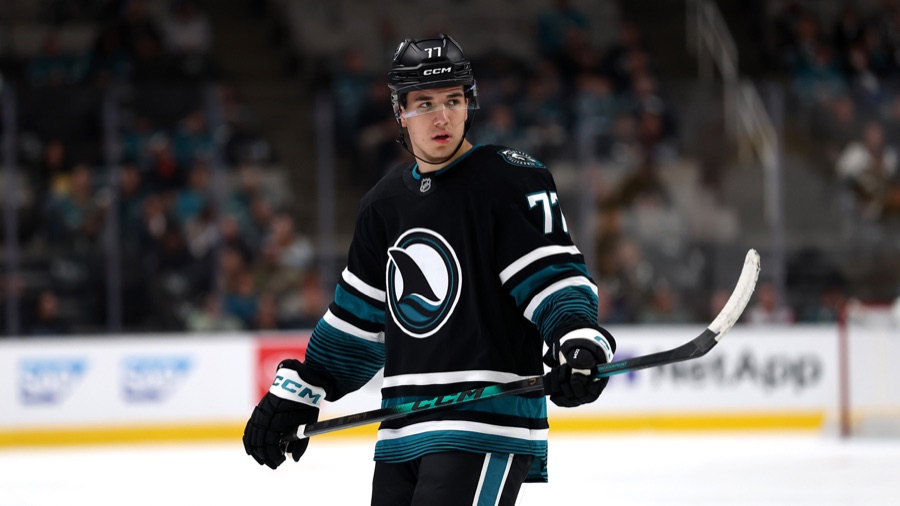
Of Alexander Wennberg's Twenty And A Half Minutes A Night, Five And A Half Came On Special Teams
Alexander Wennberg scored 55 points in 80 games last season and averaged 20:27 a night. Three minutes twenty of that was power play, second on the whole roster behind Macklin Celebrini, and two minutes eight was penalty kill. The demotion every projection has him taking is an even-strength demotion, and both published power-play projections keep him on the first unit. The number that threatens the 55 is a 19.4 percent shooting rate against a career mark of 11.4 across 869 games.
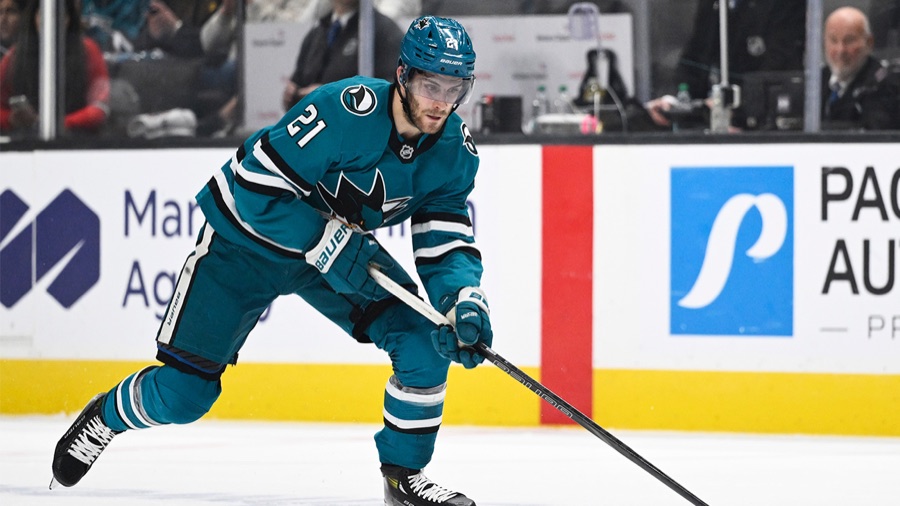
Misa vs his draft class: the box score quietly refutes the premise (and defends him)
Where Michael Misa actually stands in his draft class
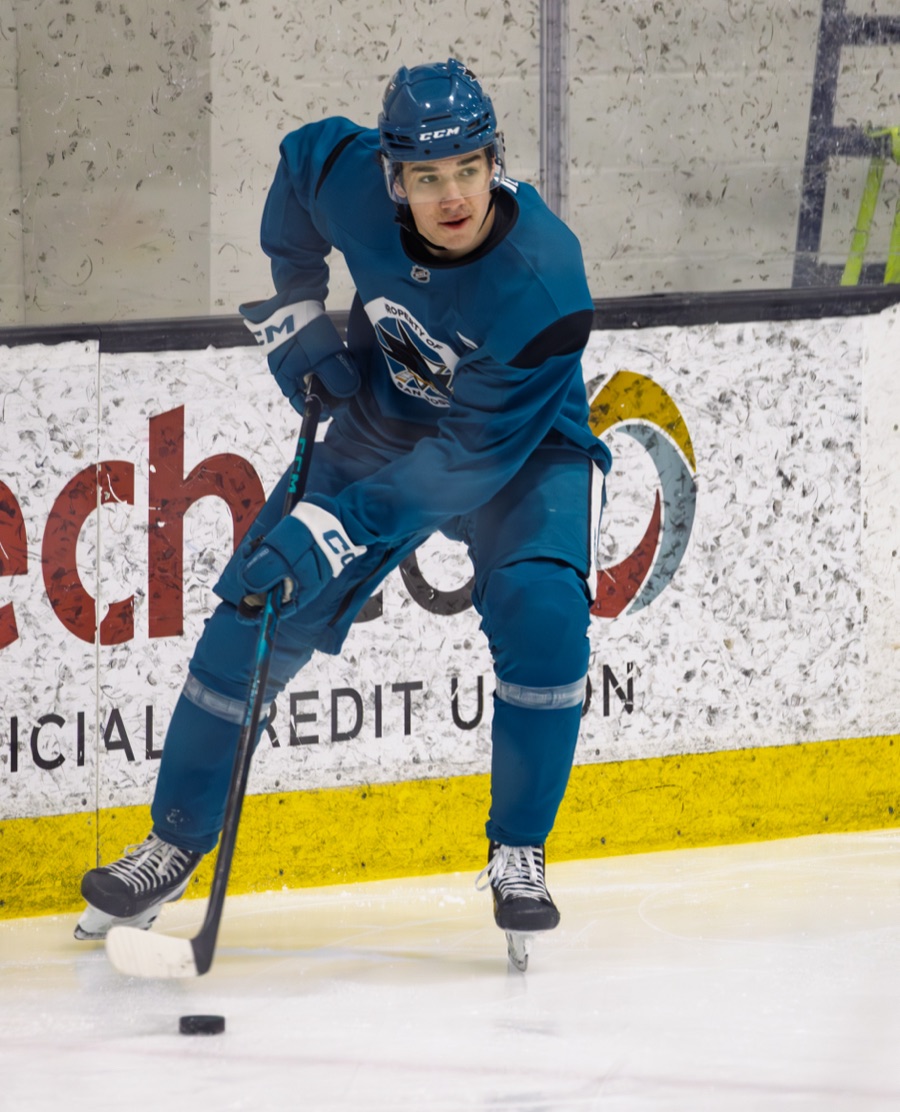
The Misa verdict: the 2C is earned, not hoped, except for one thing at the dot
Michael Misa and the second line we already promised him
The Toffoli–Misa–Graf Line: Sixty-Seven Minutes, Sixty Percent, Zero Goals Against
The 2025-26 Sharks ran out a dozen different forward combinations around Michael Misa. Nine games and sixty-seven minutes of one specific configuration produced the best per-minute